
Cleanroom Humidity Spike Case Study: Psychrometric Troubleshooting & Balancing
CED Case Study — Master HVAC Simulator & Dynamic Psychrometric Charts
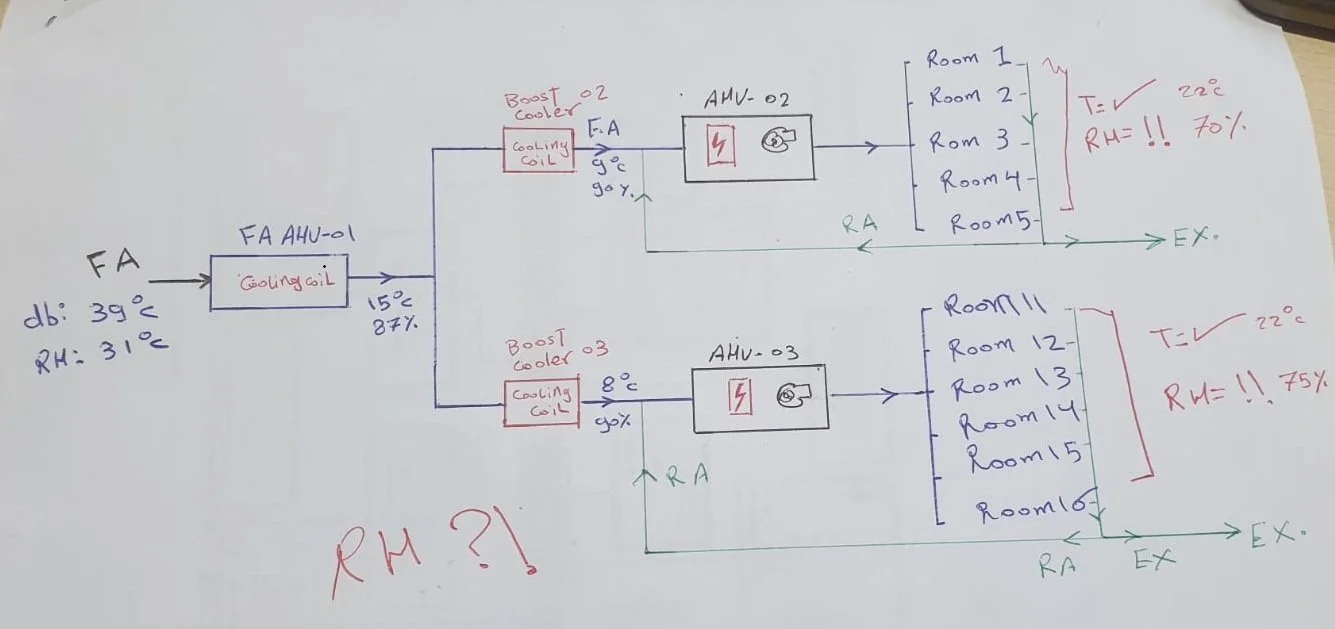
Calibrated to As-Built Drawing Specs: AHU-6101 Off-Coil (14.0°C / 99% RH) → Fan Exit (~16.0°C / 89% RH) → Booster Coils 6102 & 6103
System 2 Process: OA → 6101 Coil → 6101 Exit → Booster 6102 → Area "C & D"
COMPLIANT| State Point (Live Condition) | Tdb (°C) | w (g/kg) | RH (%) | Dew Pt (°C) |
|---|
System 3 Process: OA → 6101 Coil → 6101 Exit → Booster 6103 → Area "B"
COMPLIANT| State Point (Live Condition) | Tdb (°C) | w (g/kg) | RH (%) | Dew Pt (°C) |
|---|
Central Hydronic Performance (AHU-6101)
Area C&D Cleanroom Impact (AHU-6102)
Area B Sterile Core Impact (AHU-6103)
A Real HVAC Failure: Production Humidity Hit 80% at 20°C — Why "Cold Air" Fooled the Facility Team
Published on CED Engineering & Facility Management (ced-engineering.com)
Walking into an established pharmaceutical manufacturing facility that has operated reliably for years, only to find the sterile production suite sitting at 80% RH instead of its design limit of 50% RH at 20°C, is a high-stakes scenario.
In critical environments, the default reaction when cooling equipment appears overwhelmed is often commercial and reactionary: "The thermal loads have grown; we need a larger chiller, an additional cooling stage, or a multimillion-dollar desiccant system."
When entering an existing plant without full visibility into undocumented site modifications, guessing is costly. The correct engineering response is systematic verification: coupling physical field audits with rigorous thermodynamic modeling.
The Physical Reality vs. The Sensor Readout
The primary Fresh Air Handling Unit (FAHU) was discharging air at 16°C dry-bulb. To the maintenance team, that reading confirmed the unit was cooling properly. However, temperature measures sensible energy alone—it says nothing about moisture extraction.
The Investigation: Two Root Causes
1. Throttled Balance Valve on the Primary Fresh Air Coil (Sensible Cooling Without Latent Removal)
During a previous winter operating period, maintenance had manually throttled the chilled water balance valve serving the primary make-up coil to divert flow to other building headers. That field change was never reverted.
When extreme summer outdoor ambient conditions arrived (39°C dry-bulb with high moisture content), the choked chilled water flow caused the coil surface temperature to rise above the air stream's dew point across most of its tube passes. The coil provided pure sensible cooling without condensing moisture. The air left the unit cold to the touch, but carried a high absolute moisture content ( > 11.5 g/kg) directly into the downstream system.
2. Maintenance Deficiencies on Secondary Sub-Cooling Booster Coils
In a decoupled cleanroom architecture, secondary booster coils are charged with deep sub-cooling to strip out residual moisture before make-up air mixes with recirculated room air. Due to neglected maintenance, these booster stages could not compensate for the elevated humidity coming off the primary unit. The untrapped latent load passed straight through into the production cleanroom.
The Resolution: Zero Capital Expenditure
By validating the failure mechanism in a psychrometric balance model rather than blindly purchasing new equipment:
- The chilled water balancing valve on the primary FAHU was restored to its rated hydronic flow rate.
- Surface fouling and operational parameters on the secondary booster coils were serviced and restored.
- Cleanroom room humidity returned to its validated operating baseline (45% to 50% RH at 20°C) without procuring a single new piece of machinery.
