
Mastering the AHU Pressure Profile: From Intake to HEPA
1. The Pressure Profile
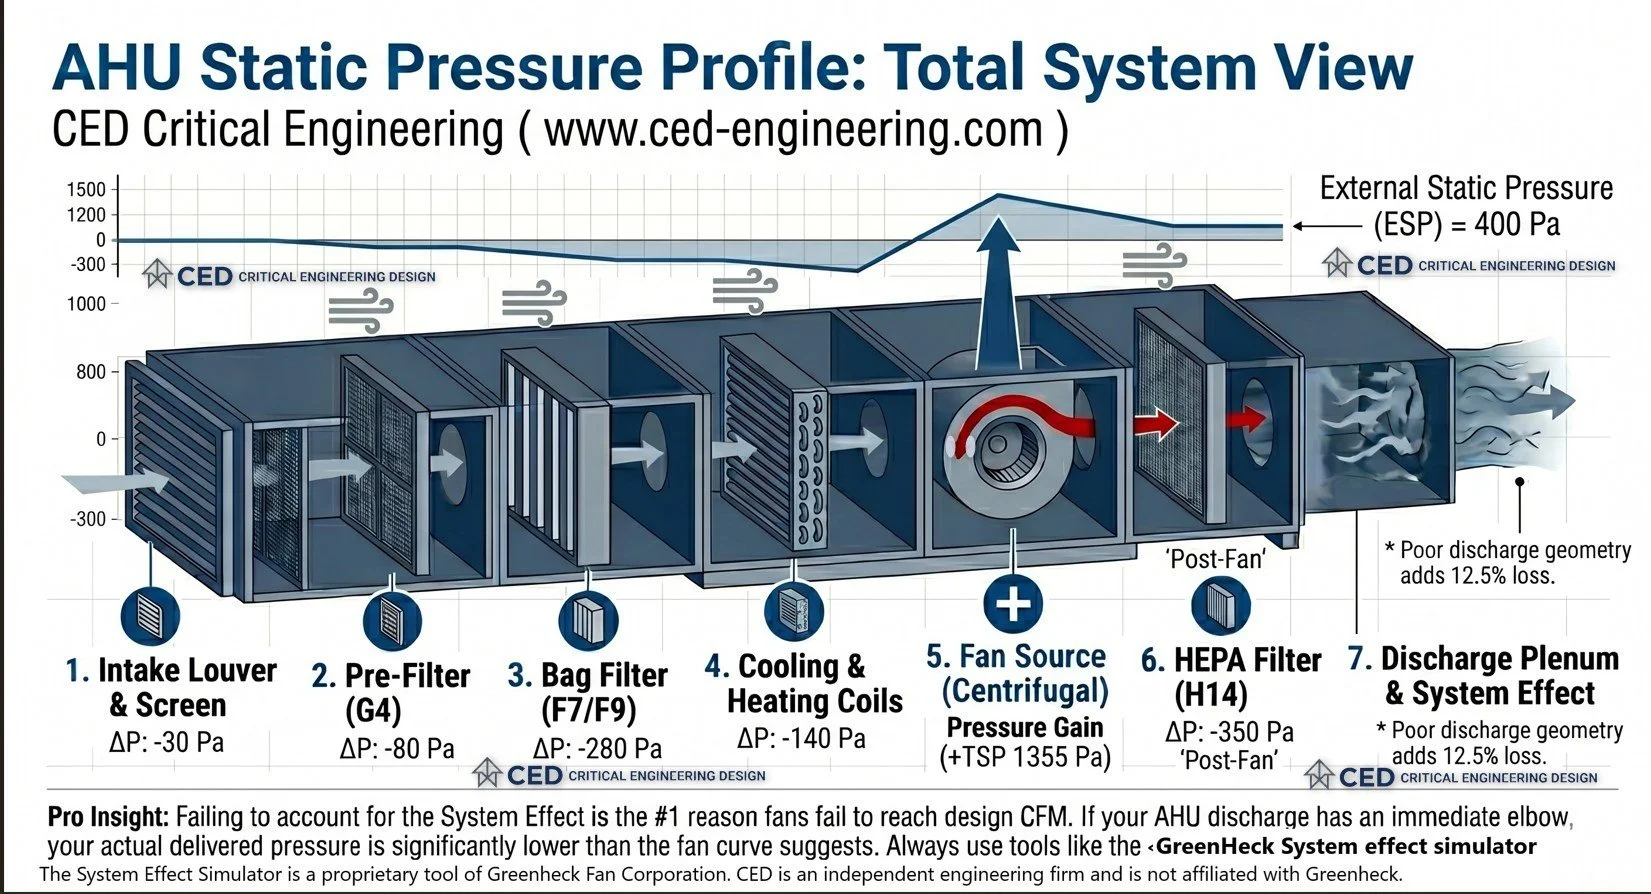
In a professional HVAC audit, we treat the AHU as a "Pressure Map." Understanding where your energy is lost is the first step in optimizing fan selection.
| AHU Component | Type of Loss | Avg. ΔP (Pa) | Technical Note |
|---|---|---|---|
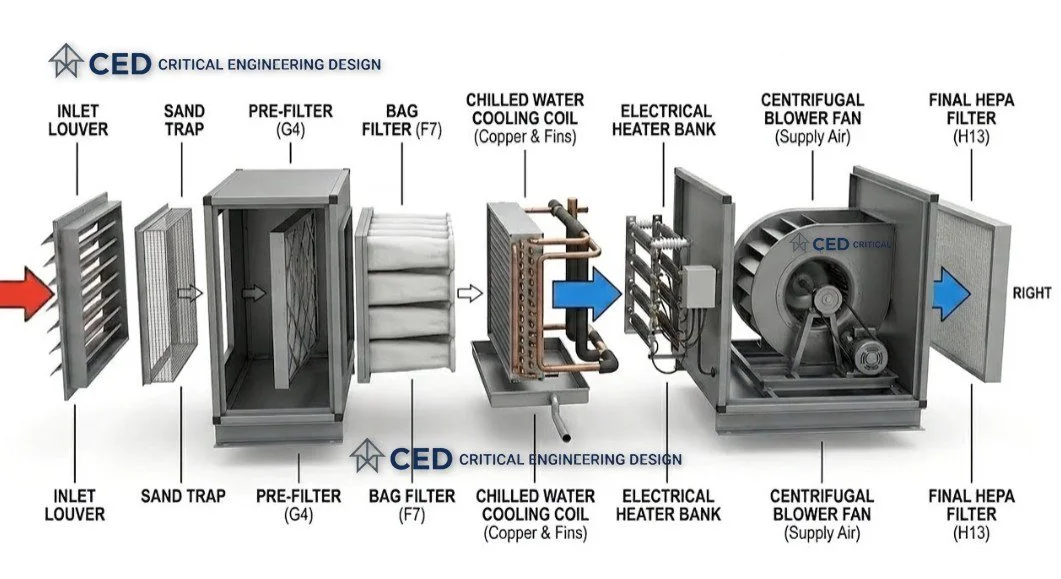
| Intake Louver | External | 20 - 40 | Account for bird screens & hoods. |
| Pre-Filter (G4) | Internal | 50 - 100 | Design for "Mid-life" dust load. |
| Bag Filter (F7/F9) | Internal | 200 - 350 | Critical: Use "Dirty" value for TSP. |
| Cooling Coil | Internal | 110 - 150 | Wet coils increase ΔP by ~15%. |
| Fan Source | Gain | + TSP | Total work required by the system. |
| HEPA Filter (H13/H14) | Internal | 250 - 500 | Final filtration stage (Post-Fan). |
| System Effect | Invisible | Varies | Losses from poor inlet/outlet geometry. Use Greenheck SES for precision. |
2. The Design Formulas
Use these definitions to ensure your fan schedule matches the actual site requirements:
- ESP (External Static Pressure): The pressure required for ductwork and terminal units.
- TSP (Total Static Pressure): All internal losses (including HEPA) + ESP + System Effect.
\( TSP = \Delta P_{internals} + \Delta P_{HEPA} + ESP + \Delta P_{SystemEffect} \)
Auditor's Note: Failing to account for the System Effect is the #1 reason fans fail to reach design CFM. If your AHU discharge has an immediate elbow, the fan curve is essentially "broken." Always simulate this loss during the design phase.
3. Interactive Component: The Filter Factor
Dynamic AHU Performance Audit
Filter: New
Current ΔP (Resistance)
120 Pa
0.48 in.w.c.
Performance Loss (%)
- 0.0 %
Compared to Clean State
Delivered Airflow (Q)
5000 CMH
2943 CFM
Available ESP
250 Pa
1.00 in.w.c.
System Status: Design Airflow Maintained.
Previous
Previous